How to visualize hearing loss
Audiograms are charts that visualize hearing loss and show why it may be difficult to understand certain sounds
Hearing loss doesn’t mean all sounds are muted or more difficult to hear. Depending on the type and degree of hearing loss you are experiencing, some sounds will be more difficult to hear than others. When the sounds that are important for speech are impacted by a hearing loss, it makes it difficult to understand speech.
Because of these variations in the way hearing loss is experienced, it isn’t simply measured as a percentage of loss – accurately representing hearing loss is much more complex.
Hearing clinicians use audiograms to visualize your hearing. After completing an audiometric evaluation, hearing aid practitioners create an audiogram to show which sounds you can hear well – and which sounds are more challenging.
What is an audiogram
An audiogram provides a method of visualizing your hearing loss and understanding its impact on your daily life.
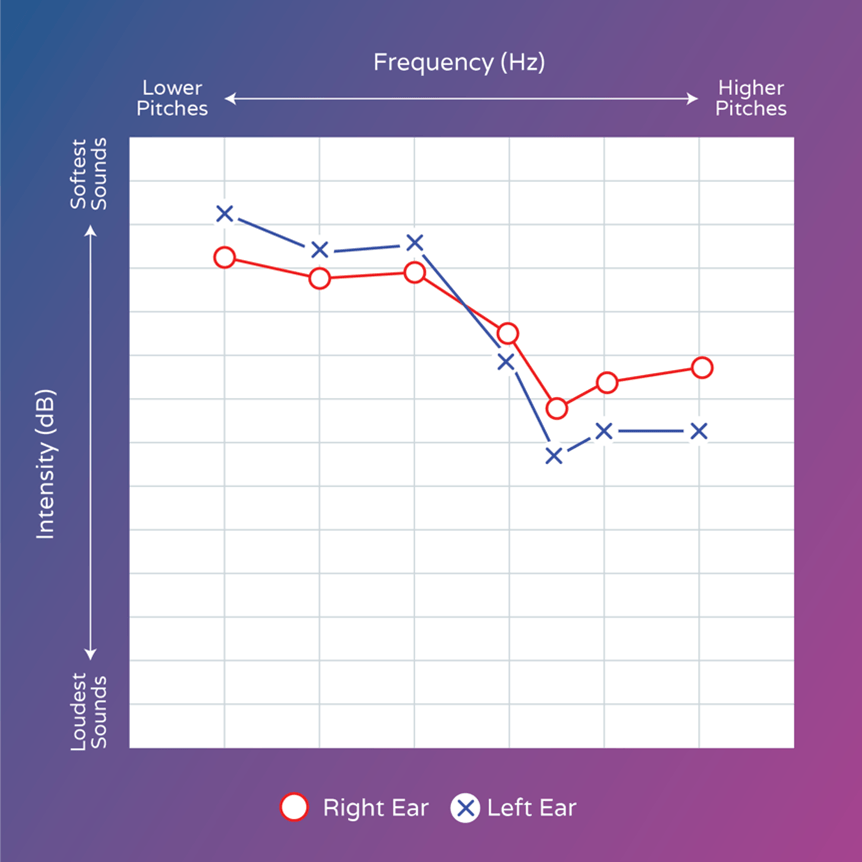
Audiograms are presented as a graph that shows the range of sounds that humans can hear and compares that with how well you hear each of those sounds in each of your ears.
In this example, both ears have challenges with hearing higher pitched sounds.
Pitch (also called frequency) is measured in Hertz (Hz) and plotted horizontally along the top of the graph. A higher frequency represents a higher pitch.
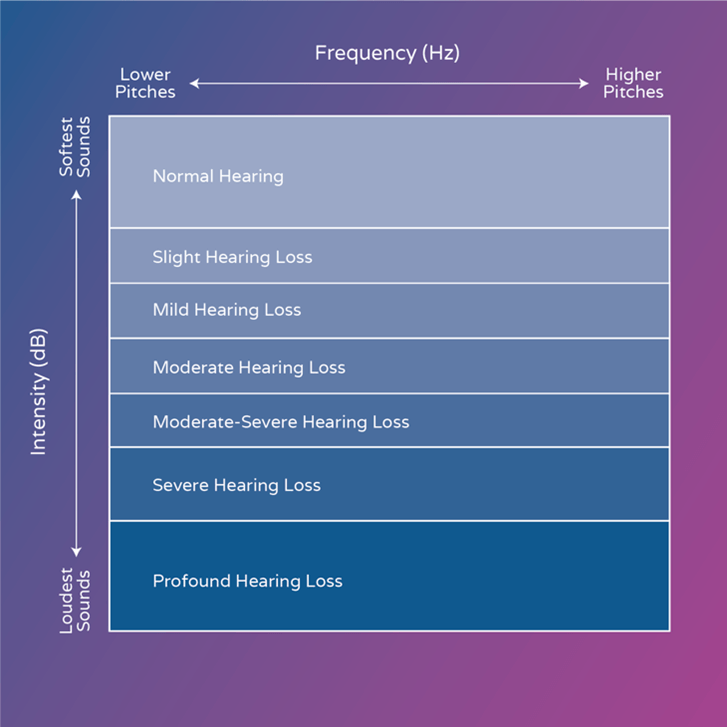
Volume is measured in decibels (dB) and plotted vertically, with the bottom representing the loudest or most intense level and the top representing the softest or quietest level.
Your hearing levels in each ear are plotted on the graph to show the softest level you can hear at each frequency.
To get an audiogram, you will need to have a full hearing test done. A hearing aid practitioner will conduct pure-tone testing to measure how well you hear different tones at varying volumes and frequencies. They will examine your hearing in various parts of the ear to help pinpoint where your hearing loss may be coming from or the reasons behind your hearing loss.
The audiogram visually charts the results of the various tests completed during your comprehensive hearing evaluation. Your clinician will review the results of these tests, and if it will be helpful, they may share your results with you in the form of an audiogram.
What to learn from an audiogram
The objective of a full hearing test is to measure how well you hear tones and speech. An audiogram shows you the specific types of sounds or frequencies that are difficult for you to hear and those that are easy for you to hear.
It shows any differences between your left and right ears and differences in hearing in various places within each ear. An audiogram also shows the pattern of your hearing loss and how severe it is.
Using all this information can help to explain hearing challenges you may be experiencing in your regular life. It can also show us why it's hard to understand certain sounds.
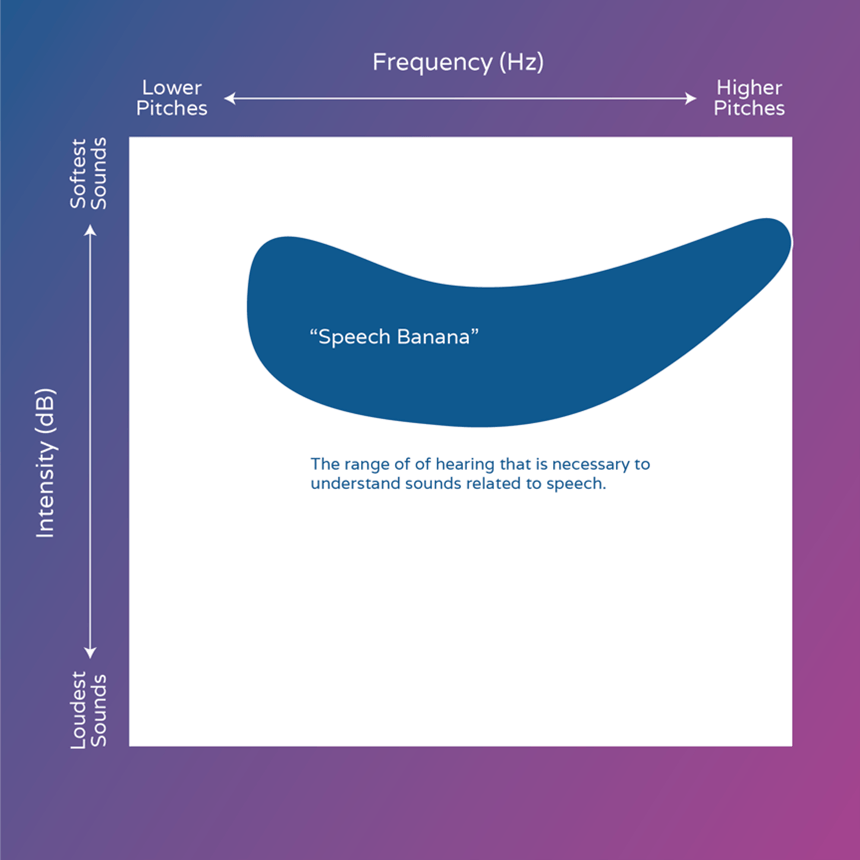
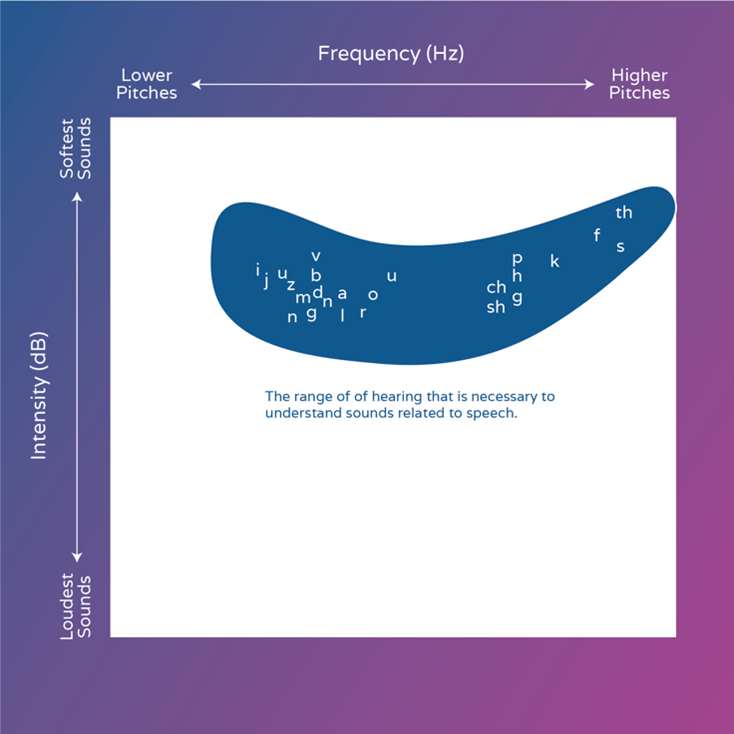
For example, an audiogram can show your ability to hear speech at varying levels and frequencies as clusters in a particular area of the graph that form a banana-like shape. This is known as the “speech banana.”.
The speech banana represents how well you hear nearly all of the sounds in human verbal language and visually demonstrates which of those sounds are difficult for you to hear.
This can be used to help you understand why you struggle to hear some words or find certain words are difficult to distinguish from one another. It can also tell us why it is harder for you to understand certain people or follow conversations in certain situations.
An audiogram provides a comprehensive picture of your hearing, which helps your hearing aid practitioner determine the best treatment options for you, such as hearing aids. It can also show you how hearing aids might contribute to better hearing.
Visualize your hearing
Book an appointment at Discover Hearing to get a full audiometric evaluation. Your hearing aid practitioner will help you understand your results and outline the best options to improve your hearing.

